Uber NYC Demand Analysis (Apr–Sep 2014)
Project Overview
This project analyzes 4.5 million Uber pickups in New York City to identify high-demand locations and time windows. Using R (ggplot2, dplyr), I processed trip logs to answer three operational questions: 1. Where are pickups concentrated? 2. When does demand peak during the day? 3. How does fleet activity shift between weekdays and weekends?
1. Geographic Distribution
Question: Is demand spread evenly across the city?

Finding: The pickup density is heavily skewed.
- Manhattan Core: The vast majority of rides occur in Manhattan (below 59th St) and Downtown Brooklyn.
- Airport Clusters: Outside the city grid, the only significant hotspots are JFK and LaGuardia Airports.
- Operational Insight: For a driver, leaving Manhattan without an airport fare is statistically inefficient, as return trips from outer boroughs are rare.
2. Hourly Demand Patterns
Question: Is there a consistent “best time” to drive?
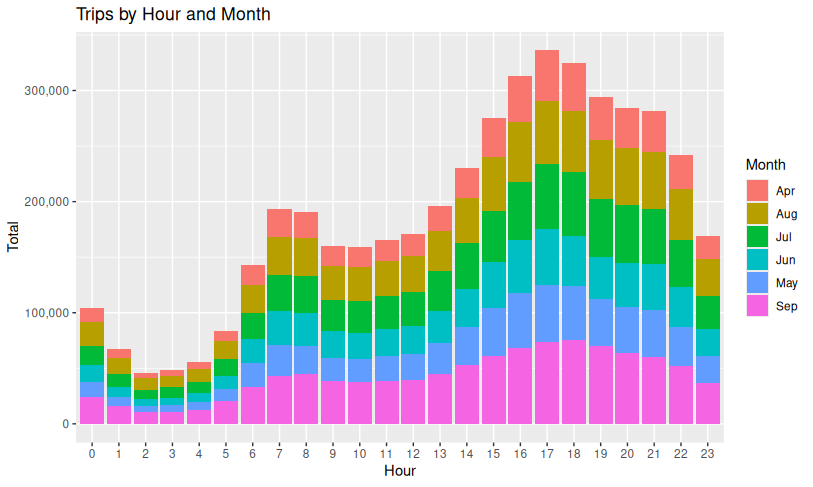
Finding:Demand follows a strict daily cycle that is consistent across all six months (Apr–Sep).
- The Build-Up: Ride volume begins to rise significantly at 16:00 (4 PM).
- The Peak: The busiest hour is consistently 17:00–18:00 (5–6 PM), coinciding with the end of the traditional workday.
- Late Night: Demand tapers off after 21:00, except on weekends (see below).
3. Heatmap Analysis: Day vs. Hour
Question: How does the schedule change from Tuesday to Saturday?
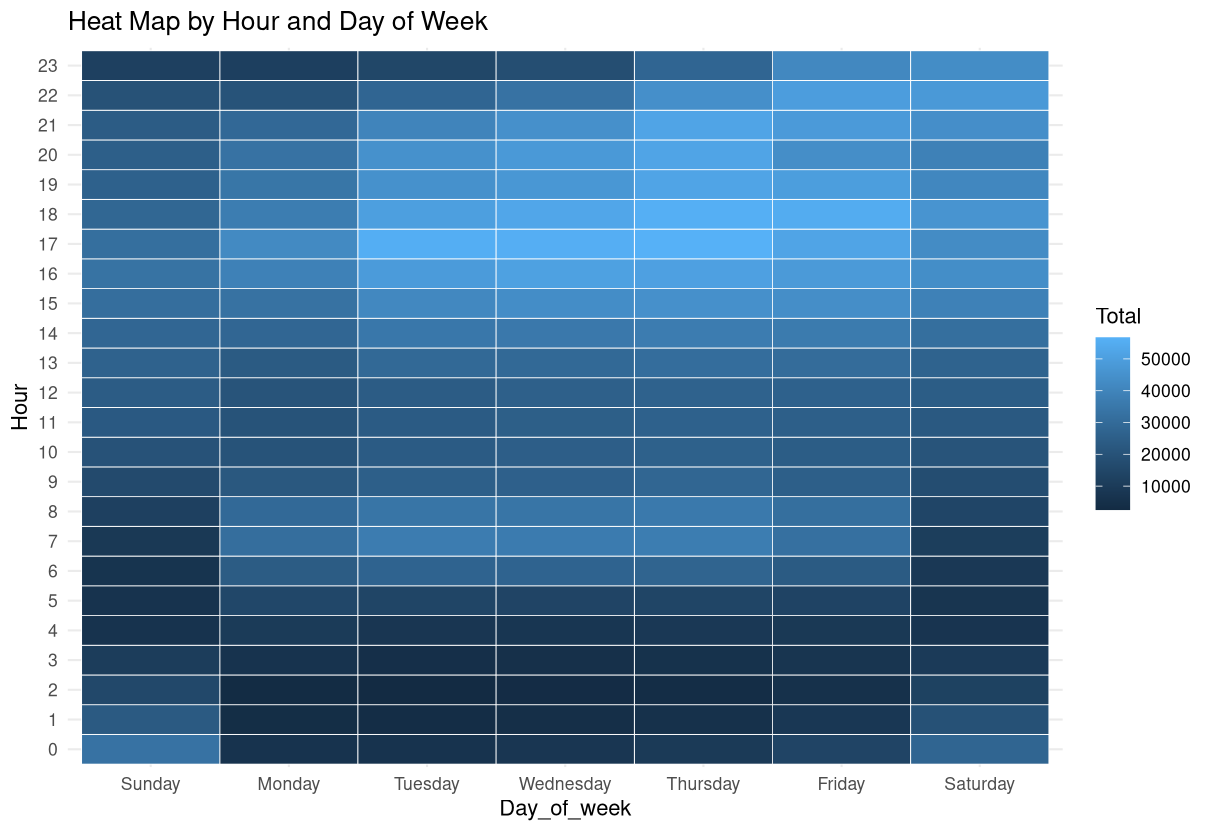
Finding: Aggregating data by day of the week reveals two distinct distinct “shifts”:
- The Commuter Shift (Mon–Thu): Demand is strictly focused on rush hours (07:00–09:00 and 17:00–19:00).
- The Nightlife Shift (Fri–Sat): The evening peak extends well past midnight, staying high until 02:00 AM.
Business Implication: Algorithms should prioritize “commuter” routes during the week but switch to “entertainment district” positioning on Friday nights.
4. Base Growth (Fleet Scaling)
Question: Are all Uber bases growing at the same rate?
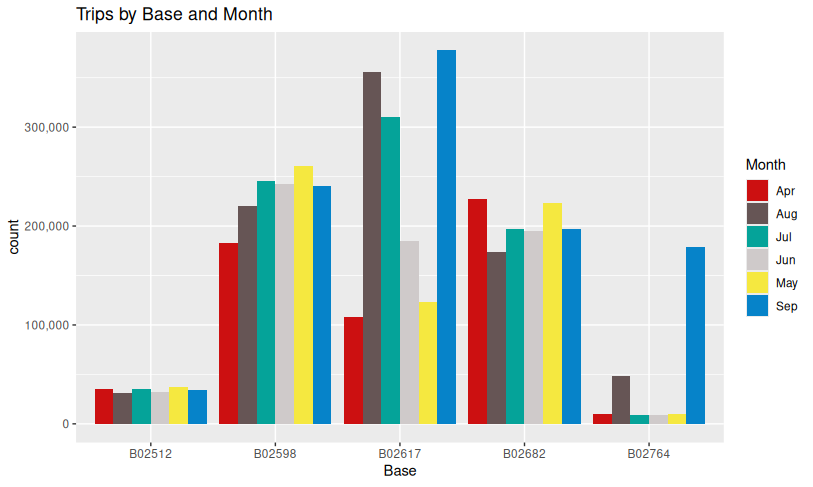
Finding: While most bases (like B02598 and B02682) showed stable monthly volume, Base B02617 (Teal) grew exponentially.
- April: ~30k trips
- September: ~180k trips
- This suggests that Uber likely consolidated drivers into this specific base or ran an aggressive onboarding campaign during the summer of 2014.
Technical Implementation
Stack: R, RStudio Key Libraries:
ggplot2: Used for the heatmaps and bar charts.lubridate: Parsed the timestamps to extract Hour, Day, and Month factors.dplyr: Grouped the 4.5M rows for aggregation.